
In our modern world, the work of many people no longer consists of manual labor, but rather mental work, which is also called “Knowledge Work”. Knowledge Work is characterized by the fact that it cannot be accelerated by external pressure. If at all, this is only possible through the inner (intrinsic) motivation of knowledge workers. (more about knowledge work). This article describes how a wrong system prevents effective knowledge work and slows down the work process. It also describes a simple way to improve.
When we came into the organization for the first time, the product development process included the following steps:
- Create initial product concept (application team)
- Elaborate product configuration (application team)
- Product design: 3D models, parts lists, drawings and approval (engineering team)
- Prototyping: component procurement, manufacturing and delivery (production)
- Measurements on the prototypes (in several laboratories)
- Pre-analysis of the measurement results and development of change recommendations (in the laboratories)
- Overall analysis of the measurement results and optimization of the product concept (application team)
- If not finished, go to step 2
The management had imagined that ideally the process should look something like this:
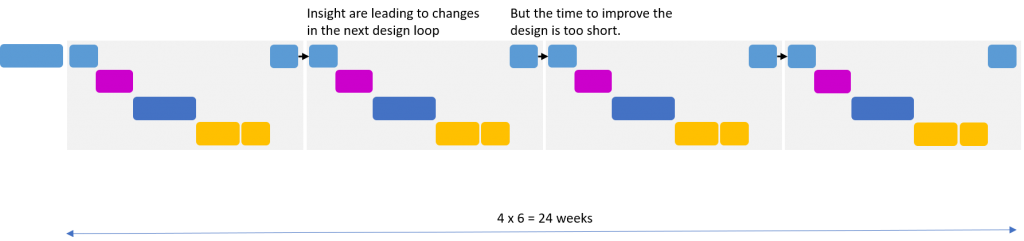
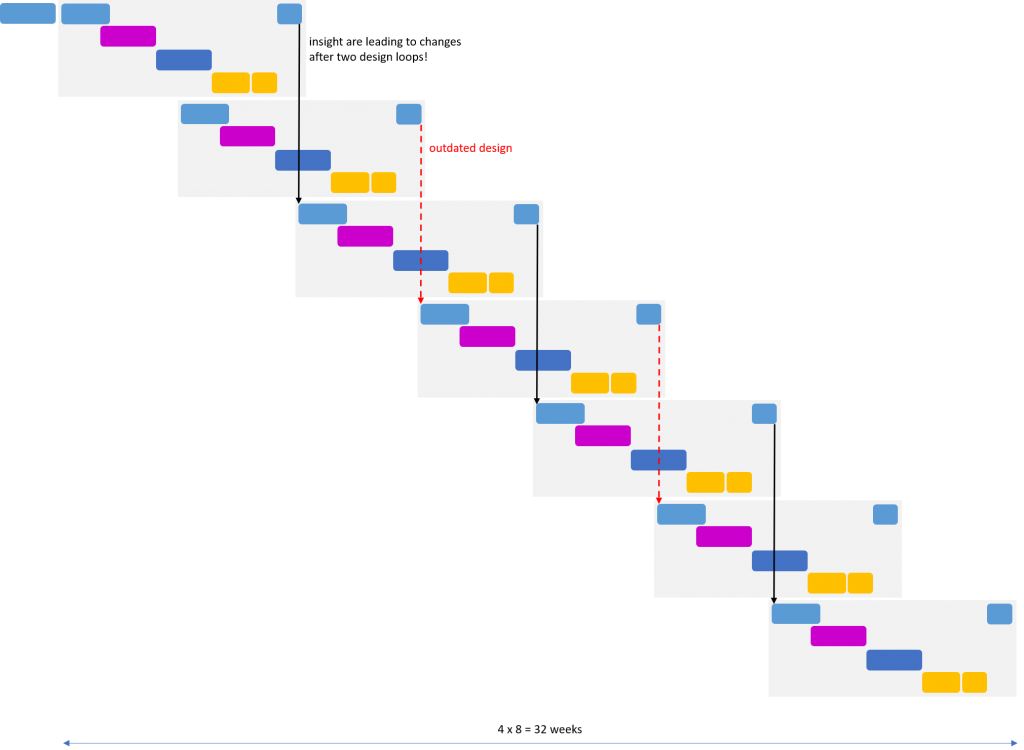
The problem
Unfortunately, however, due to the fast pace of prototyping and delays in prototype delivery, the time for design improvements was so short that the application team couldn’t keep up with the pace of change and therefore released changes too quickly. The teams were lagging behind in analysis either, so they started to skip prototype cycles. This resulted in the following picture with a greatly increased effort, increased time and a great amount of dissatisfaction among all people involved.
Improvements
As a first step towards a solution, we only recorded and documented the working method and made it transparent on a Kanban board.
Then we integrated the most critical measurement team (yellow) into the application team to better prioritize the measurements and communicate the results earlier and more effectively. This alone led to a significant improvement in the mood within the team and a slight increase in speed, because the application developers were able to coordinate directly with the measurement engineers on a daily basis.
Now it became even clearer that the measurements and optimizations were always made under time pressure to quickly design and build a new prototype. This “hot potato” approach led to quick conclusions and shortcuts.
Together with the Product Owner of the application team, we then deliberately decided to give the developers almost double the time to test and optimize a prototype (8 instead of 5 weeks). The goal was to increase the quality of the results and the design optimizations. At first everyone declared us crazy. We would delay the already slow process even further.
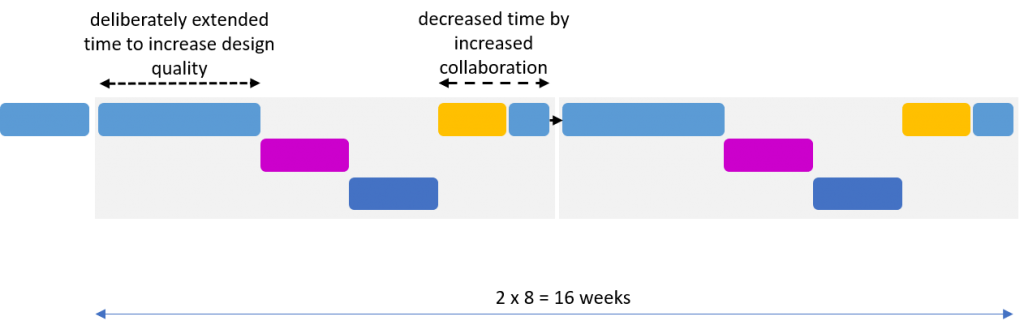
But, already after a few iterations we found out that the additional time invested led to quality improvements and better designs. As a result, less than half of the design iterations were needed and we were almost twice as fast overall.
Further improvements
More simulation
The basic idea is to build virtual prototypes through simulation. However, we quickly realized that the simulation is only as good as the underlying model. And this often means that creating the concrete and complex model requires more effort and time than building and testing a physical prototype. Furthermore, there is still the uncertainty that the model does not represent the whole truth.
Nevertheless the simulation path is not wrong. However, it is necessary to compare simulations with physical prototypes in order to learn which design aspects can be represented by simulations and which cannot. This validation of simulation parameters requires time and increases the effort. It represents an investment in the future.
Set-based Design and Visual Knowledge as an ideal solution
In a first step we generate and visualize knowledge by determining the limiting curves within the solution space. Then this knowledge is used to find suitable concrete solutions within the solution space. This may sound more difficult than it is. Often there is already a lot of data from earlier measurements, which can be used by suitable visualization.
An example: With the prototypes frequently built up to now, life cycle tests were carried out in which several devices were operated in an “endurance run” at each stage of development and performance-critical parameters were measured every x runs. One criterion behind this was, for example, that after two years of average use, 80% of the performance should still be available. In addition to the high costs for personnel and equipment for test operation, even in continuous operation such a thing still takes several months of time, and that is exactly what we do not have in development. A closer look reveals that the basic course of performance degradation always looks similar.
When comparing these curves, it became apparent that you we actually don’t have to go through a full two years of operation, because the curve shows a tendency quite early on whether a design will pass or not. If the question is even “Is design A or B better?”, we can read this even easier and earlier from the curves.
If such data is not available from older measurements, we must proceed differently: By deliberately making small changes, we learn which design and parameter changes create which effects. By recording the most important parameters and visualizing them as limiting curves, we expand our knowledge.
I will soon write about set-based design and visual knowledge in a separate article.