Classic management likes to argue with cost aspects when it comes to changing and optimizing processes. In this article, we will disregard all social aspects concerning employees for the moment and just compare the bare figures.
It is about the widespread misconception that a company only operates profitably when all employees are working at full capacity. Elliahu Goldratt described this very clear for manufacturing companies in his business novel “The Goal“. Later books described also development and marketing aspects (“The goal II”, “Velocity”).
Now let’s look at different cost types and cost models.
Cost of inefficiency
This is the simple and obvious part: a resource that is not working because it is underutilized costs money even though it is not performing. There is a cost of underutilization that is the higher the less the resource is working productively. Because this is so easy to measure and seems to yield a lot, most management systems focus on this metric.
“Obviously, the highest productivity is only generated at 100% utilization.” Wrong!
Figure 1 shows the cost of non-utilization (=cost of inefficiency) over the utilization of a resource.
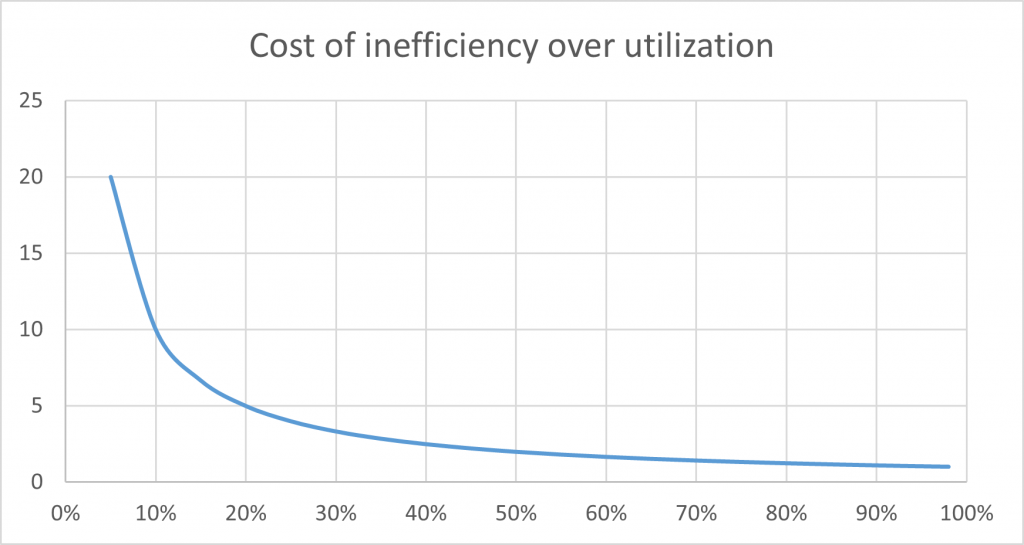
The idea behind this model is that a resource that is only half utilized, relatively speaking, generates twice the costs.
“If the resource is not fully utilized in one project, it gets work from other projects. Problem solved.” Really?
From this perspective, it would always be good for multi-project management to schedule more projects than are theoretically feasible, so that even in the case of faster completion of work, all resources are kept busy. But in reality, this produces more pressure, task switching and slows down the process (less performance and more waiting).
Now comes the part that is not so obvious:
Costs due to delayed delivery (aka Cost-of-delay)
Costs due to delayed delivery include the impact of time on the results.
What do these arise from? Once by the fact that the longer occupation of resources costs more money, but also by later completion of the project just worked on, so that money is earned later and important market share is lost, especially in today’s fast-moving times. In addition, all further projects are also delayed, which means additional lost money.
The queuing theory explains that the more busy the system or resource is, the longer the waiting times for new requests (customer projects or new opportunities) arriving at random.
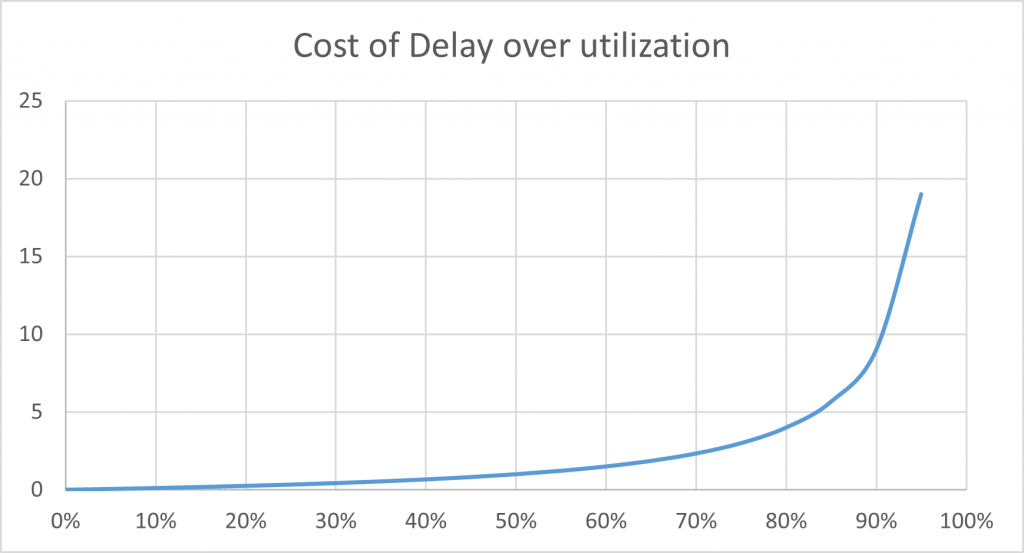
But it gets worse: Due to high specialization and the separation of responsibilities in the companies, there are more and more handovers between the processors, which multiplies the waiting times. Whereas a moderately complex industrial product used to require about 25 experts, today there are often more than 100, and they are usually no longer located in one organization and at one site, but are spread across the globe via many suppliers and subcontractors. Since a project does not continuously provide tasks for each of these experts, even more projects are executed in parallel. But this causes additional losses due to task switching.
Furthermore, by distributing tasks among more people and multiple organizations, additional tenders, purchase orders, project managers, controllers and managers become necessary. This is not even considered in our example. In addition we generate costs due to short-term recruitment and training of employees or transfer of work to an external organization (out-sourcing).
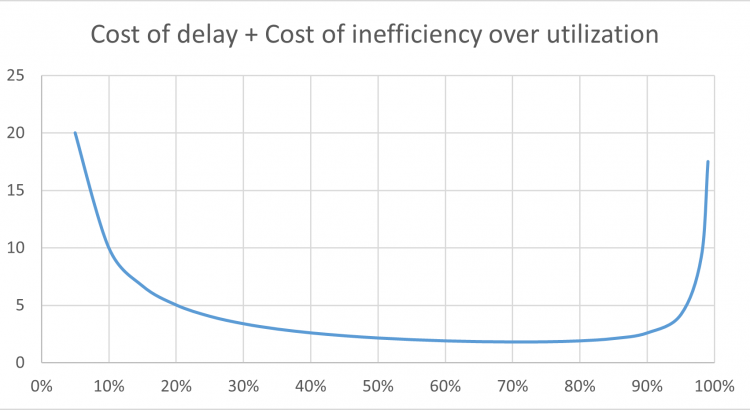
It can be seen how small the costs due to non-utilization in the upper utilization range are compared to the delay costs. Unfortunately, however, delay costs are usually not measured or even estimated.
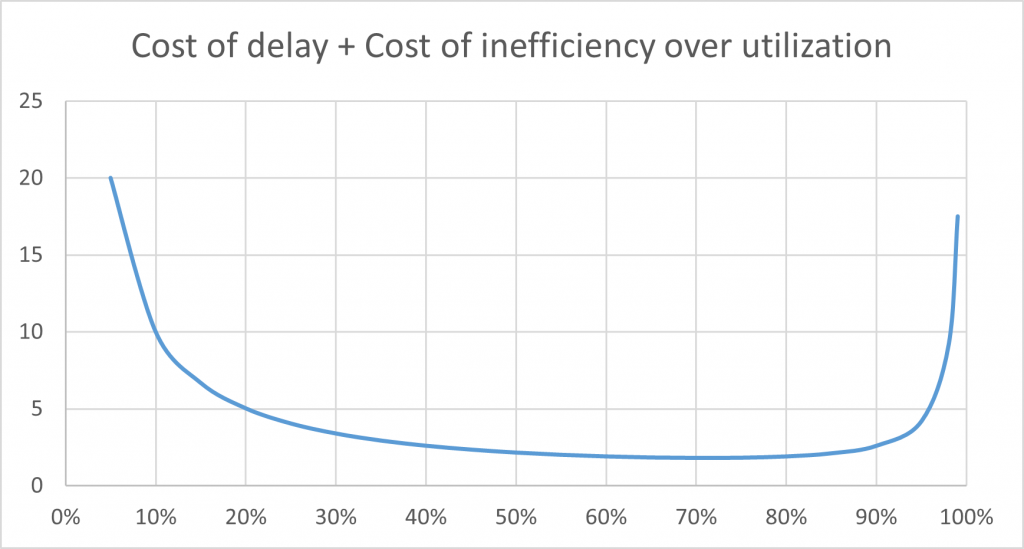
As shown in Figure 3, the lowest costs in this example occur at a utilization rate of 71%. The figure shows the total costs, regardless of when they are incurred.
The problem is that the different costs occur at different times. However, many organizations and their managers today are driven to act in the short term (e.g. through stock exchange listing and temporary management contracts) and thus have the compulsion to deliver good quarterly figures in the short term. In our experience, family-owned companies have a much better basis for this, as they usually think much more long-term.
It is difficult not to do urgent things that are not important. It is usually easier to prioritize all things that need to be done and to work on them consistently from top to bottom. The visualization through a backlog (stack of items), known from Kanban and Scrum, helps here. If the dimension of the effort is added, the Upswing-Gravity-Field from the P4-Framework may help.
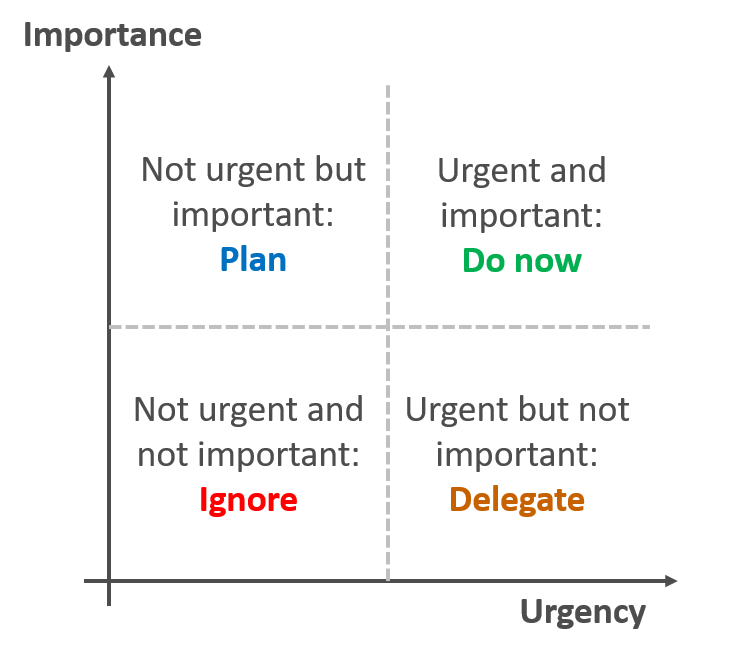
Figure 4: Eisenhower matrix
It is a very human trait to prioritize short-term (urgent) issues higher than long-term (important) ones. While many are familiar with the well-known Eisenhower matrix, they often fail to strike a balance that makes sense for the organization in the long term. This builds up “technical and organizational debt” for which interest must be paid in the form of money and extra effort until it is repaid.
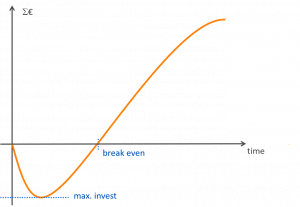
Ultimately, thinking and acting for the long term, always means investing in the future, whether it is developing new technologies, building staff or process improvement measures. The so-called J-curve is often used to illustrate investment and profit. This shows the progression of investment and profit over time, which helps to make good decisions about individual measures. The parameters “maximum investment”, the “break-even” point in time, i.e. the point in time when the profits achieved have paid back the losses, and the return-on-investment, i.e. the ratio of profit and investment are helpful here.
Technical and organizational “debts” are things that were consciously or unconsciously not done, e.g. …
- reduced product quality due to less testing
- poor reuse of system architectures due to missing adaptations (e.g. by refactoring)
- higher cycle times in product development due to missing adaptations of team structures
- loss of knowledge due to lack of employee training
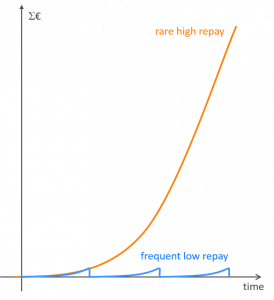
Figure 6: Building-up and repay of technical and organizational debts.
If technical and organizational debts are not repaid promptly, they add up to considerable amounts, which then leads to complete restructuring or new product development, and in the worst case to the closure of an organizational unit. As Figure 6 shows, regular payback and short periods are the key to paying off debts. Iterative frameworks such as Scrum and the P4 framework support this.
More about the Monopoly of projects
More about Multi-projektmanagement
More about Projects in resource limited systems
